Carrying out a vehicle datalogger
Introduction
The goal of this project is to develop a kind of datalogger collecting different peaces of information from OBD-II (On-board diagnostics), GPS, and IMU (Inertial measurement unit) and to store them into a CSV file in an SD card. The developped datalogger has to meet certain requirements to operate. These are:
- Freematics ONE+ board.
- Freematics Arduino Builder for compiling and uploading code.
- Freematics ONE+ Driver.
- SD card.
How to run the project ?
Once you fulfill all the needs above, you clone the depository then you load the ./FreematicsOBD/datalogger/simple_obd_test.ino using
the Freematics Arduino Builder. You choose the appropirate target board. Tick Rebuild Core and Rebuild Llibs. Finally, connect your board to the computer, click on refresh then click on the last added serial port to upload the project.
Now, you can connect the device to the OBD port of the vehicle. Turn on the engine and wait until you hear a beep from the board buzzer. At this time, the board is ready to collect information. If the buzzer does not work, you just reconnect the board and wait again.
If you want to see the data written in SD card in real time and visualize them on your screen. You may need a longer USB wire. However,
you need to set USE_SERIAL to 1 (otherwise 0) which exists in the ./FreematicsOBD/datalogger/simple_obd_test.h.
If you want to collect just GPS and IMU data while cycling you can power the board with a power bank. You will need to set USE_OBD to 1 (otherwise 0) which exists in the same header file.
In order to avoid collecting data during traffic jumps you can set SLEEP_STOP to 1 (otherwise 0). This makes the board go to deep sleep for 5s.
How to visualize the collected data ?
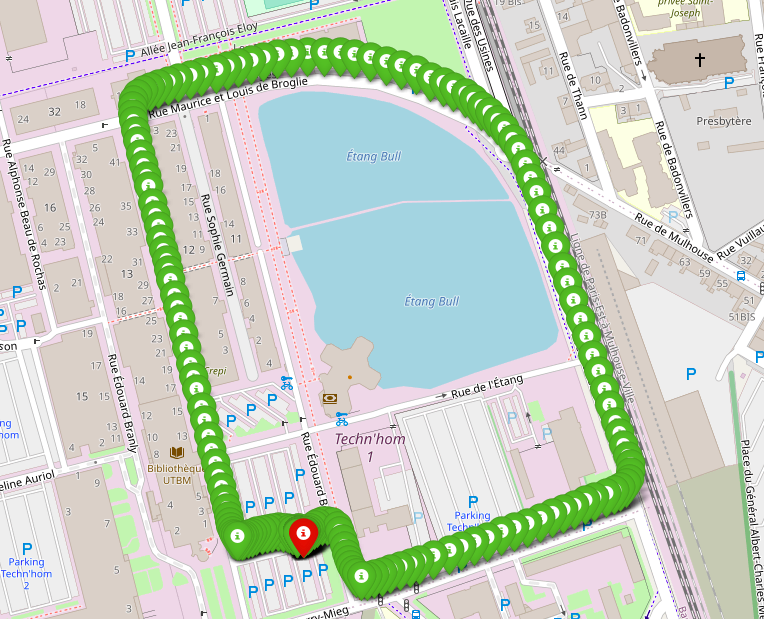
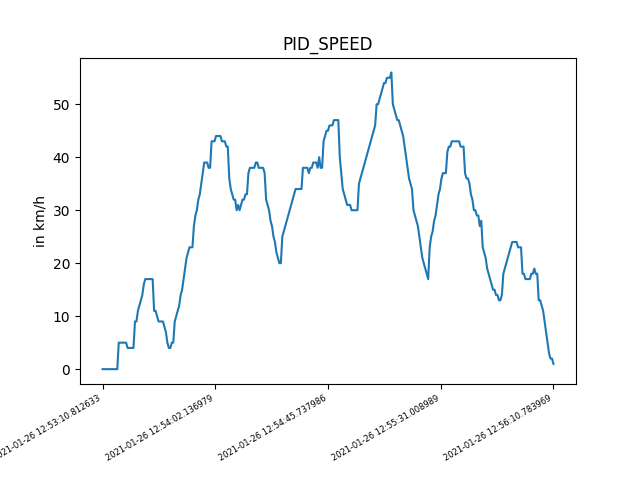
To plot some magnitudes or the path, you can use the python script. This script needs two arguments. The first one is the name of the CSV file. The second one is HTML file which can be opened with a navigator and see the journey path. You can also reduce the number of points drawn on the map by uncommenting the call of rdp function. This one has a parameter called epsilon. The bigger epsilon is the lesser points you get.
To plot a magnitude you can follow the examples given in the script file.
Example of launching the python script: python3 script_gps.py 27.CSV Trajet.html.